
Over the last two weeks, my team and I have embarked on our biggest stock buying spree since the Covid-19 pandemic emerged in March 2020.
We’ve done so because dozens of the fundamental, technical, and sentimental indicators that we closely track have hit extremes recently. And they’re extremes that they only tend to hit when bear markets bottom and new bull markets are born.
And last Friday afternoon, we discovered the most compelling of these indicators.
It’s a technical indicator that flashed an “extreme fear” signal just last week. This indicator has flashed this exact same signal more than 100 times over the past 32 years. Every single time, the stock market was higher a year later, with an average return of nearly 30%.
Needless to say, after we discovered this technical indicator, we became more bullish than ever.
This bear market may not be completely over. But it’s almost certainly in its final innings. And the weight of evidence today strongly suggests that investors who buy stocks now will make a lot of money over the next 12 months.
So, we’re buying stocks today.
Here’s a deeper look.
The Weakest Market Ever?
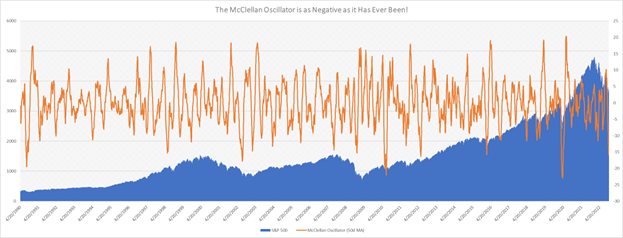
The technical indicator we are referring to is the McClellan Oscillator.
In short, it is a unique statistical measurement of the number of advancing stocks in the market relative to the number of declining stocks. It’s a market breadth indicator.
Specifically, the indicator measures the difference between the 19-day and 39-day exponential moving averages of net advancing stocks. The higher the difference, the wider the market breadth. The lower the difference, the narrower the market breadth.
The McClellan Oscillator is broadly considered the best way to measure stock market breadth.
In any event, the 50-day moving average of the McClellan Oscillator dropped below -15 last week, and has stayed below that reading ever since.
That’s an unusually weak McClellan Oscillator reading. It’s about as weak as the reading has ever been. It speaks to “peak fear” and “peak weakness” in the market.
For context, this oscillator has dropped below -15 only 109 times before on record (going back to 1990), meaning the oscillator has spent just 1.4% of trading days where it is today (below -15).
Now, here’s the bullish part: Stocks tend to rally big after the McClellan Oscillator gets this negative.
And not just sometimes – but ALWAYS.
A Perfect Track Record
Guess when the last time was that the McClellan Oscillator was this negative? Yep – March 2020, at the depths of the Covid-19 pandemic.
How about before that? June 2016 – right after the Brexit vote.
And before that? June 2012, when everyone was worried that the economy would slip back into a deep recession.
The McClellan Oscillator was also this negative in June 2010 (amid a foreign debt crisis), November 2008 (at the depths of the great financial crisis), August 2002 (the bottom of the dot-com crash), June 1999, and August 1990.
What do all these months have in common? They were all very, very close to an absolute bottom after a stock market rout.
The other thing they have in common? Stocks soared in the months that followed.
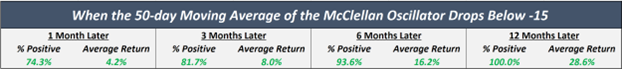
Here’s the exact data. Since 1990, on the 109 occurrences when the McClellan Oscillator dropped below -15:
- 74% of the time, stocks were higher a month later, with an average return of 4%.
- 82% of the time, stocks were higher three months later, with an average return of 8%.
- 94% of the time, stocks were higher six months later, with an average return of 16%.
- 100% of the time, stocks were higher 12 months later, with an average return of 29%!
In other words, we just discovered a technical indicator with a 100% track record (on over 100 data points) of calling a stock market bottom and new bull market – and predicting massive returns over the next 12 months.
That’s a big deal.
The Final Word on the New Bull Market
It increasingly appears the stock market is working through a bottoming process right now. There’s a ton of evidence suggesting as much.
If so, that’s incredibly bullish, because the greatest returns in stock market history are made when bear markets turn into bull markets.
On average, the stock market rises about 10% per year. But after the 2020 bear market, stocks soared 27% in 2021 – about 3X their average.
After the brief 2018 bear market, they popped 29%.
After the 2008 bear market, they rose 24%.
Following the 2002 bear market, they soared 26%.
And after the 1990 bear market, they popped 26%.
You get the point. In the years after bear markets turn into bull markets, stocks tend to soar by more than 20% or more than double their average annual return.
They perform twice as good.
But certain stocks tend to rise hundreds – even thousands – of percent during this transition.
These special stocks are called “divergence stocks.” And we’ve developed a quantitative way to identify them and capitalize on them for explosive returns.
You can learn about the best stocks to buy now for a new bull market breakout here.
On the date of publication, Luke Lango did not have (either directly or indirectly) any positions in the securities mentioned in this article.